

2025-02-14
This write-up was originally posted on reddit, though I've cleaned things up specifically for this post. Due to reasons discussed towards the end of this post, I'm not entirely happy with the results and intend to take another shot at it in the near future.
I came across this post sharing a hypothesis from a French subreddit;
The closer to the train station, the worse the kebab.
The original French post gained a decent amount of traction compared to the subreddit's relatively small size, indicating a certain amount of agreement among its members. There were some detractors in the comments, however, sharing experiences which ran contrary to the stated hypothesis.
Thus, I figured I had nothing better to do, being a burned-out, unemployed drop-out with a newly-obtained autism diagnosis, so I figured I'd sacrifice my time for a worthy cause and perform this informal "study". I'll be expecting my Nobel peace prize in the postbox and several job offers in my DMs within the next 3 working days.
I assumed the best study area to be Paris, France since;
I haven't personally heard of this hypothesis in my home country (Sweden, also home to many a kebab-serving restaurant) so I figured I'd assume this to be a French phenomenon for the purpose of this informal "Study".
The inner city is dense with dozens of train/metro stations and god knows how many kebab shops. I knew early on that this would make my life pretty miserable, but at least it'd provide plenty of sample data.
I used OSMnx to download and save a navigation network. Given the public transit-centric nature of the French subreddit, I though it'd make sense to stick to walking distance (eg. footpaths, side-walks) thus i set the OSMnx network_type to "walk". Given the location (and that OSMnx used this CRS automatically when none was provided), all data was projected to EPSG:32631 (UTM zone 31N).
import osmnx as ox
from geopandas import GeoDataFrame

#EPSG
PROJECTION = 32631

graph = ox.graph_from_place('Paris, FR', network_type="walk")
graph = ox.project_graph(graph, to_crs=PROJECTION)

ox.save_graphml(graph, filepath="network.graphml")
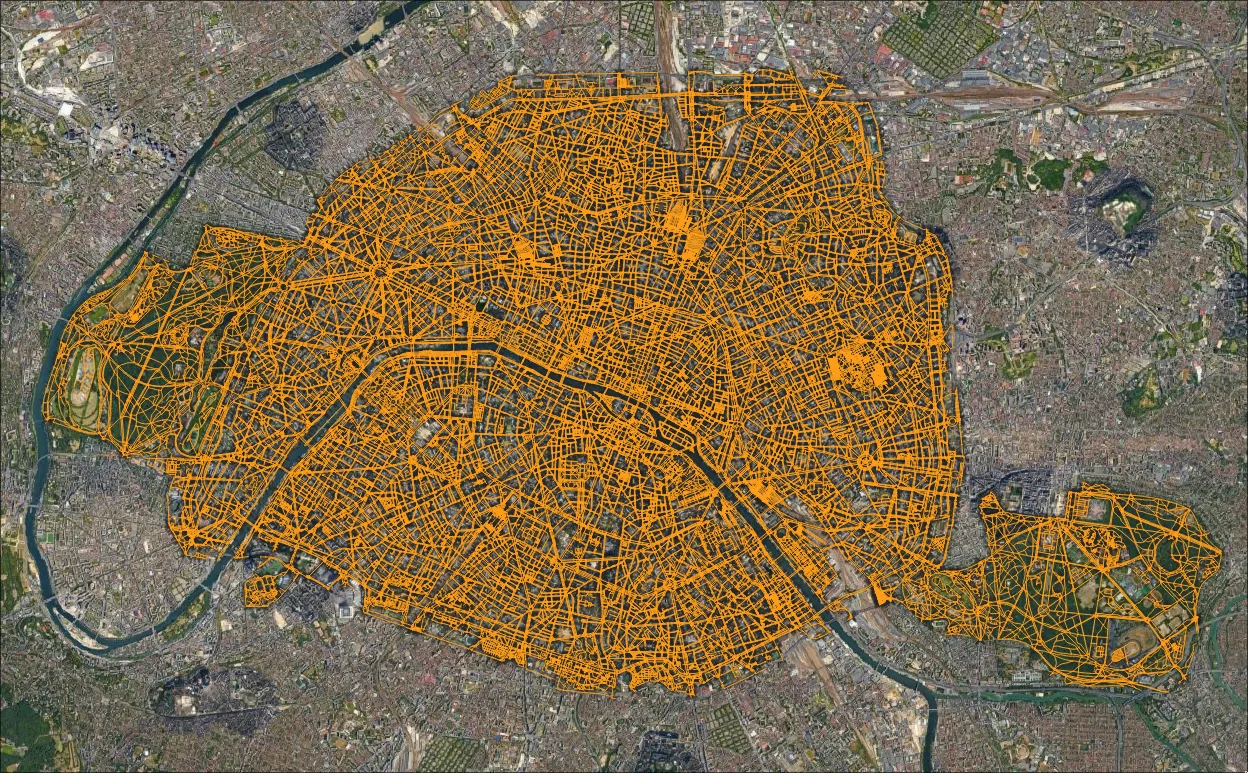 Figure 1: The study area and network
Next up is the various train/metro stations. Given the nature of the original French sub, I figured it'd make sense to include both the long-distance central stations along with the countless metro stations. This was also rather trivial with OSMnx, filtering by railway=subway_entrance or railway=train_station_entrance.
stations: GeoDataFrame = ox.features_from_place('Paris, FR', tags = {
    "railway": ["subway_entrance", "train_station_entrance"]
})

# Filter results to points
station_nodes: GeoDataFrame = stations.loc[stations.geom_type=="Point"]
station_nodes = station_nodes.to_crs(epsg=PROJECTION)

station_nodes.to_file("train_station_entrances.gpkg")
I saved outputs religiously so I could easily inspect them in QGIS. I did attempt to get python notebooks working with my NeoVIM setup, but it was all for naught.
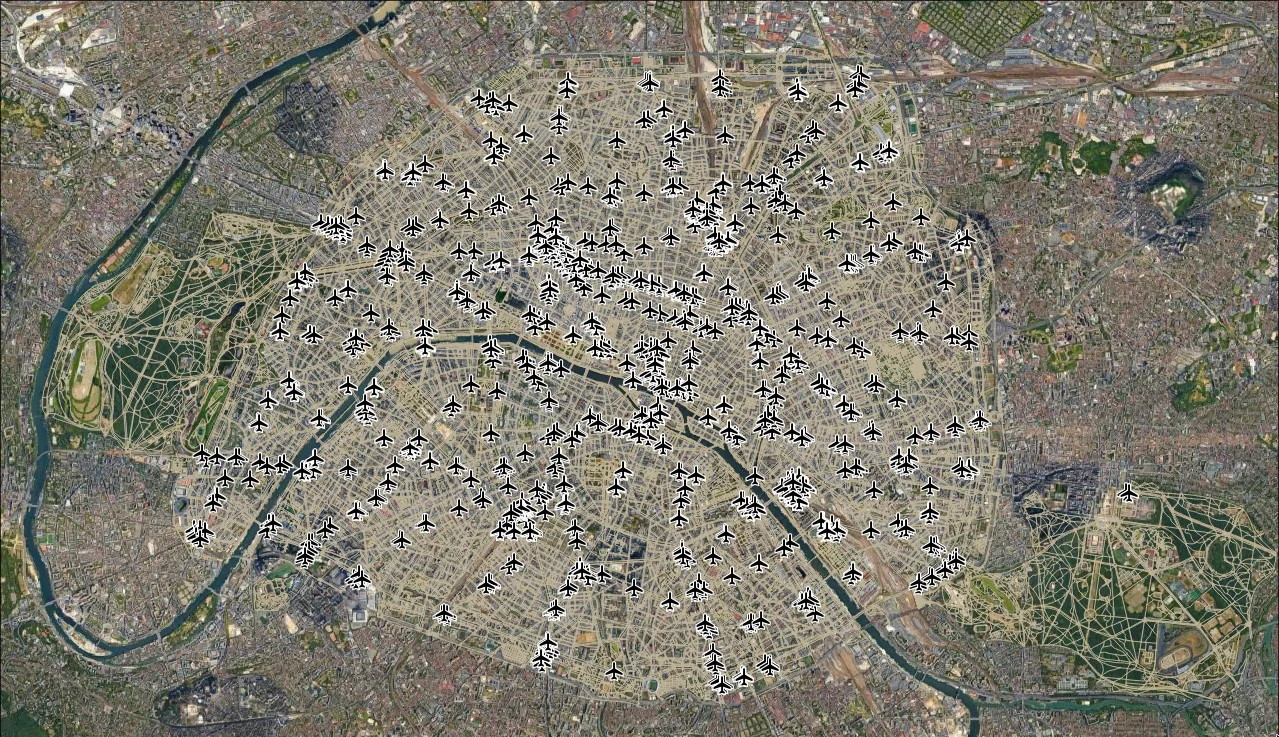 Figure 2: Rail/metro entrances... Please ignore the airport iconography.
... And there we have the first half of the data, now for the restaurants.
The Google Places API (and their respective reviews) seemed like a reasonable choice. Google reviews are naturally far from perfect and subject to their fair share of botting and the like, but it's the best I could think of at the time. There are alternatives such as Yelp, but their API is horrifically expensive for poor old me, and I was not in the mood to build a web scraper (it has the same soul-sucking effect on me as prompting an LLM). The $200 of free credit was also enticing.
However, as I started exploring the API... I realised that the Places API doesn't seem to have any way to search within a polygon, only within a point radius. Thank you, Mr. publicly owned mega-corporation. How Fun.
It also didn't help that autocomplete for the googlemaps library wasn't working. Python's a fine language, but its tooling does like to test my patience a little too often. And whilst I'm still complaining... The Google Cloud dashboard is likely the slowest "website" I've ever had the displeasure of interacting with.
So... This meant I'd have to perform some sort of grid search of the whole of Paris, crossing my fingers that I wouldn't bust my free usage. This, along with a couple interesting questions;
When I search for "kebab" (no further context necessary)... How does Google decide what restaurant serves kebab?
After some perusing, it didn't seem to be as deep as I thought. Plenty of restaurants simply had "kebab" in the name, some were designated as "Mediterranean" (Kebab has its origins in Turkey, Persia, middle east in general) and others had a fair few reviews simply mentioning "kebab." Good enough for me.
It turns out that when you query for places within a given radius, it's only a "bias." It's not a hard cut-off that'll help narrow-down our data harvesting and reduce unnecessary requests. It was becoming increasingly clear that google isn't really a fan of people doing this.
Now with all of that preamble out of the way, I needed to prepare my search.
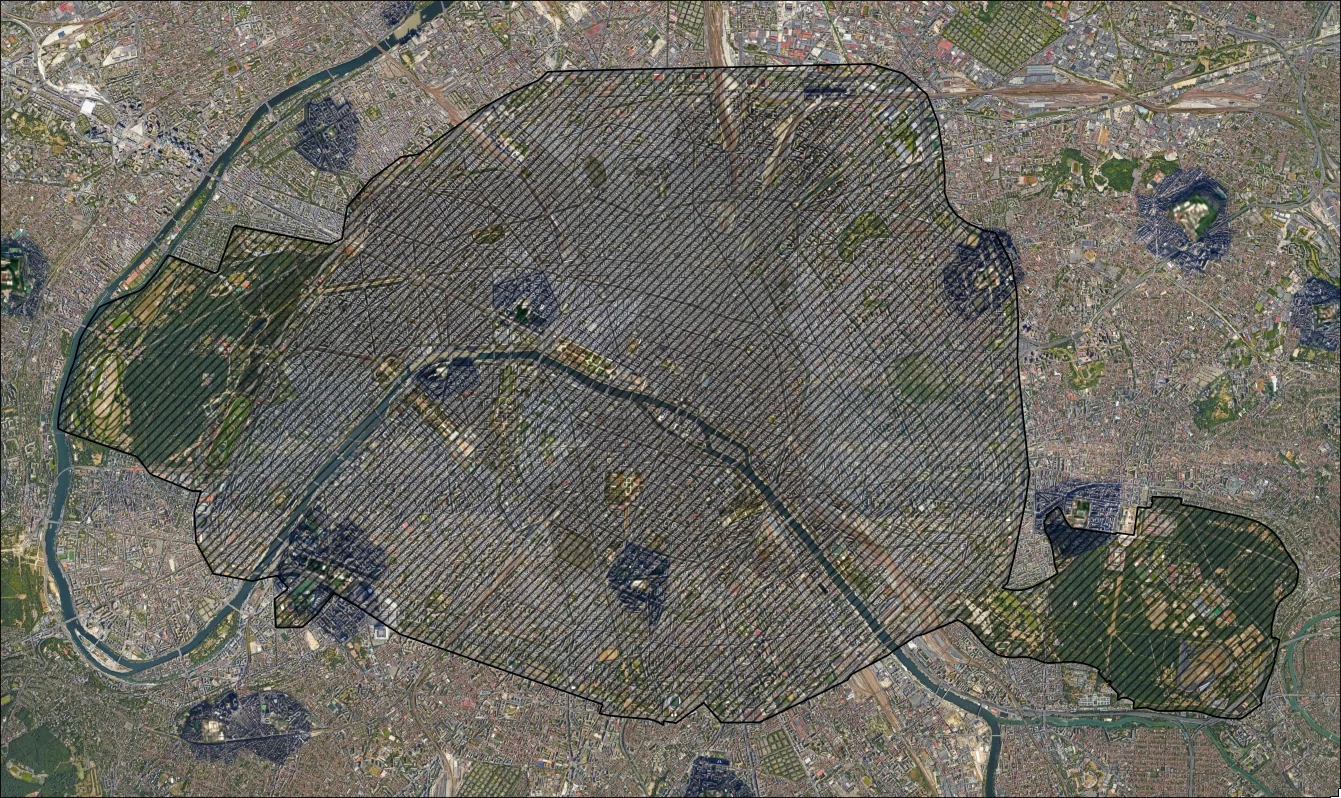 Figure 3. Original admin boundaries
Paris' administrative boundary contains a couple of large green spaces. To the west, a park and to the east, some sort of sports institute.
After perusing these rather large spaces in Google maps, they seemed to contain a distinct lack of kebab-serving establishments. Thus, they were a burden on our API budget and needed to go.
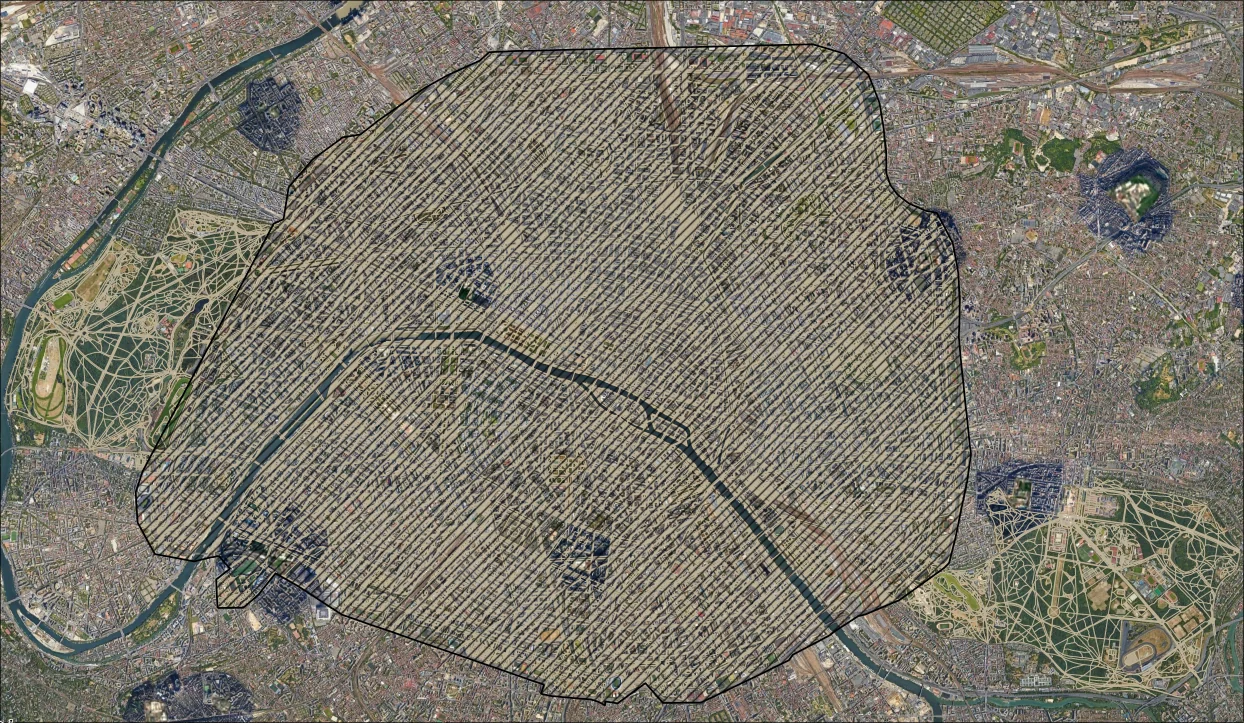 Figure 4. Adjusted admin boundaries w/ network
I figured keeping the network and stations wouldn't do any harm, so they went unmodified.
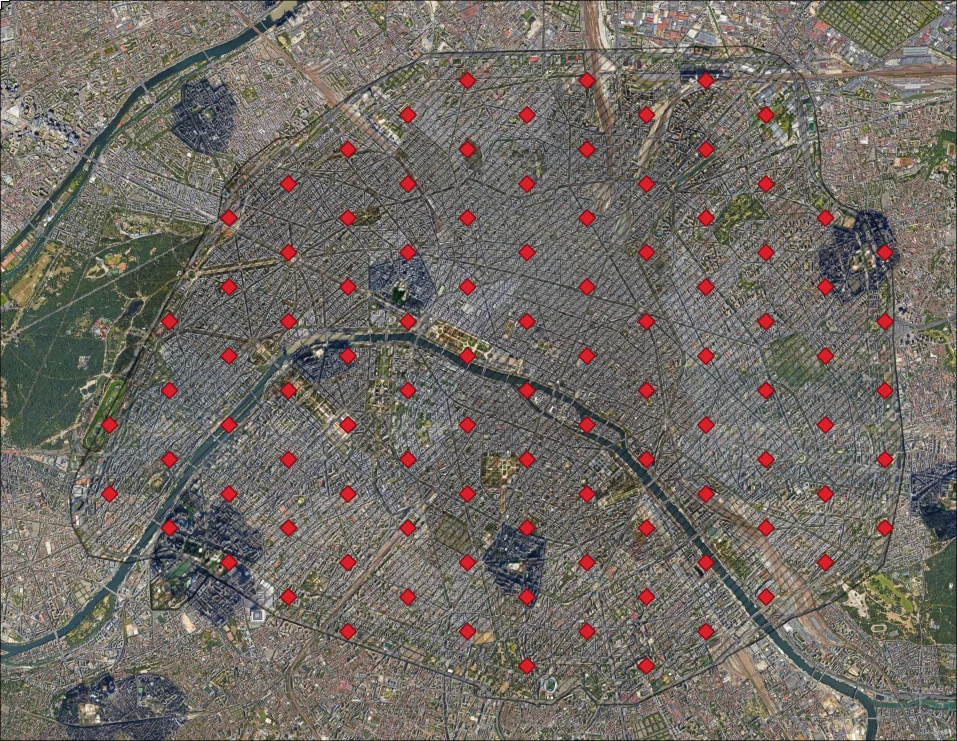 Figure 5. Sampling points, later projected to WGS84 for harvesting purposes
To maximise data-harvesting, I decided to go with a hex layout with a vertical spacing of 1 km. This should give us a search radius of 500m * √3 ~= 866 meters. Plenty of overlap, sure, but we shouldn't be getting any holes anywhere. I'm not sure why I was spending this much time ensuring "data integrity" when that might just have flown the window courtesy of Google, but it's the illusion of control that counts.
This give us 99 sample points which... Should be enough?
Regardless, here's how my 3AM python turned out:
# Already projected to WGS84
sample_points: GeoDataFrame = GeoDataFrame.from_file("samples.gpkg")
gmaps: googlemaps.Client = googlemaps.Client(key='get-your-own')

output = {}

for point in sample_points.geometry:
    lat, lon = point.y, point.x

    next_page_token = None
    num_fetches = 3

    while num_fetches > 0:
        result = {}

        if next_page_token == None:
            result = gmaps.places(
                "kebab",
                location=(lat, lon),
                radius=866,
            )
        else:
            result = gmaps.places(
                page_token=next_page_token
            )

        next_page_token = result.get("next_page_token")
        print(result["status"], next_page_token)

        for p in result["results"]:
            output[p["place_id"]] = p

        if next_page_token == None:
            break

        num_fetches -= 1

        sleep(2)

json_out = json.dumps(output)

with open("output.json", "w") as file:
    file.write(json_out)
This worked quite well. Initially I skipped paging, resulting in 322 results. However, I noticed that a few establishments were missing in the results compared to my explorations in Google Maps.
After implementing paging and re-running, this gave us a grand total of 400 kebab-serving establishments. I was likely over-zealous with the paging considering how few additional results were retrieved. That, and that the API doesn't cap the search radius (again, it's only a bias) likely led to a fair few redundant API calls.
The raw Google Places API-output also needed to be clipped to the study area, projected to the local UTM zone as well as converted to a geospatial format;
import pandas as pd

with open("output.json", "r") as file:
    data = json.load(file)
    file.close()

    for id in data:
        place = data[id]
        point = place["geometry"]["location"]
        data[id]["lng"] = point["lng"]
        data[id]["lat"] = point["lat"]
        del data[id]["geometry"]

    data = pd.DataFrame.from_dict(data).T
    data.rating = pd.to_numeric(data.rating)
    data.user_ratings_total = pd.to_numeric(data.user_ratings_total)
    data = data[data["user_ratings_total"] > 0]

    # Cleanup was added after the screenshot below was taken
    data = data.drop(columns=[
        "icon",
        "icon_background_color",
        "icon_mask_base_uri",
        "plus_code",
        "reference",
        "photos",
        "opening_hours"
    ])

    gdata = GeoDataFrame(
        data, geometry=geopandas.points_from_xy(data.lng, data.lat),
        crs=4326
    )

    gdata: GeoDataFrame = gdata.to_crs(PROJECTION)

    # Modified boundaries from Figure 4.
    paris = GeoDataFrame.from_file("mod_bounary.gpkg");

    gdata: GeoDataFrame = gdata.clip(paris)

    gdata.to_file("establishments.gpkg")
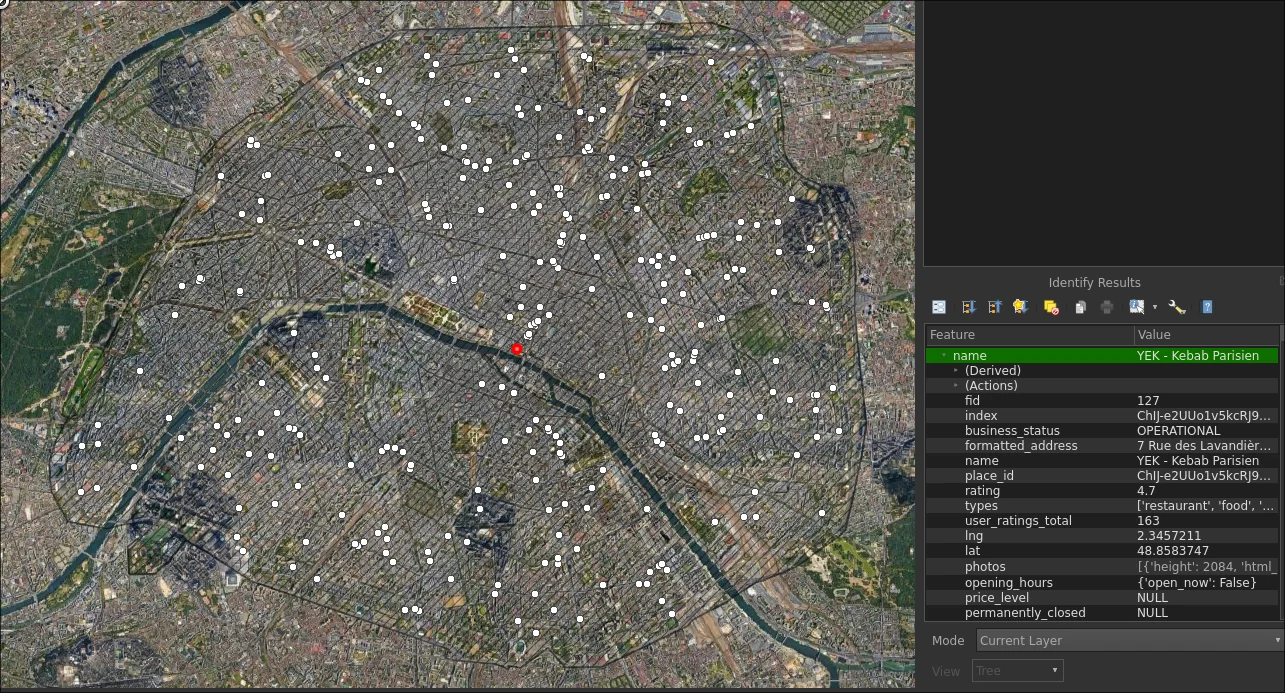 Figure 6. We're in f###ing business
Finally, the fun part. I need to get the distance to the nearest station entrance for each establishment.
I could've absolutely just routed to every single entrance for every single restaurant to get the nearest... But that would've taken several decades. I needed to build some sort of spatial index and route to the nearest ~3 or something along those lines. Since Paris is so dense with plenty of routing options, I figured I wouldn't need to perform too many routing operations.
After some googling and dredging through API docs, however, it seemed GeoPandas was nice enough to do that for us with sindex. Although it didn't have the same "return nearest N" like my beloved r-tree rust library I was all too used to, it did allow me to search within a certain radius (1 km was large enough) and go from there. The query results weren't sorted, so I had to sort the indexes by distance and cut it down to size.
The network analysis was relatively straight-forward thanks to NetworkX, and after a couple of hours I managed to cobble together the following;
import networkx as nx
import shapely as shp

establishments: GeoDataFrame = GeoDataFrame.from_file("establishments.gpkg")
entrances: GeoDataFrame = GeoDataFrame.from_file("entrances.gpkg")
graph = ox.load_graphml("network.graphml")
graph = ox.project_graph(graph, to_crs = PROJECTION)

# Ensure the same CRS
if (establishments.crs != entrances.crs != PROJECTION):
    exit(100)

# Helper function to get the distance between a graph node and establishment geometry
def node_geom_dist(node_id: int, geom: shp.Point):
    node = graph.nodes[node_id]
    return math.sqrt((geom.x - node['x']) ** 2 + (geom.y - node['y']) ** 2)

distances: list[float] = []

for (id, establishment) in establishments.iterrows():
    establishment_geom: shp.Point = establishment.geometry
    establishment_node: int = ox.nearest_nodes(graph, establishment_geom.x, establishment_geom.y)
    establishment_dist_to_node: float = node_geom_dist(establishment_node, establishment_geom)

    # Spatial index for rail entrances
    index: shp.STRtree = entrances.sindex
    nearest_q = index.query(establishment_geom, predicate="dwithin", distance = 1000)
    nearest_entrances: list[tuple[int, float]] = []

    for i in nearest_q:
        ent = entrances.iloc[i]
        ent_geom: shp.Point = ent.geometry

        dist = ent_geom.distance(establishment.geometry)

        nearest_entrances.append((i, dist))

    nearest_entrances = sorted(nearest_entrances, key = lambda e: e[1])[:3]
    entrance_geom: list[shp.Point] = [entrances.iloc[i].geometry for (i, _) in nearest_entrances]
    entrance_nodes: list[int] = [ox.nearest_nodes(graph, point.x, point.y) for point in entrance_geom]
    entrance_geom_dist_to_node: list[float] = [node_geom_dist(entrance_nodes[i], entrance_geom[i]) for i in range(len(nearest_entrances))]

    result_paths = [nx.shortest_path(graph, establishment_node, dest_node, weight="length") for dest_node in entrance_nodes]
    result_lengths: list[float] = [nx.path_weight(graph, path, "length") + entrance_geom_dist_to_node[i] + establishment_dist_to_node for (i, path) in enumerate(result_paths)]

    distances.append(min(result_lengths))

establishments["distance"] = distances
establishments.to_file("establishment_results.gpkg")
Not exactly my finest work. The sheer amount of list comprehension is perhaps a little terrifying, but it works.
After some prodding around in QGIS with the resulting data and networks (and many print() statements), I was confident in the accuracy of the results.
Now with all of this data, it is time to settle the question of whether or not the kebabs are less tasty the closer they are to a train/metro station...
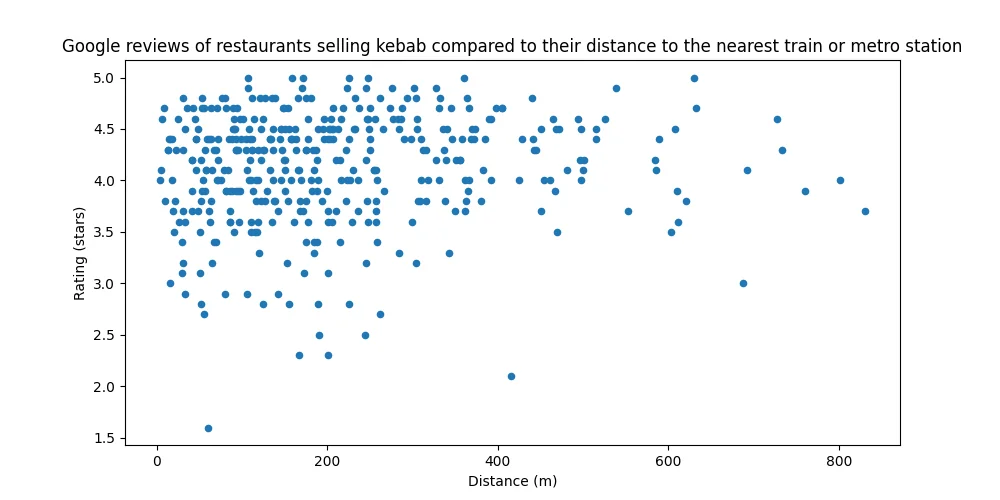 Figure 7. Hmmmmm....
With a mighty Pearson's correlation of 0.091, the data indicates that this could be true! If you ignore the fact that the correlation is so weak that calling it 'statistically insignificant' would be quite generous.
Outliers can have an outsized impact on a Pearson's correlation, so after ridding the dataset of some outliers via IQR fencing...
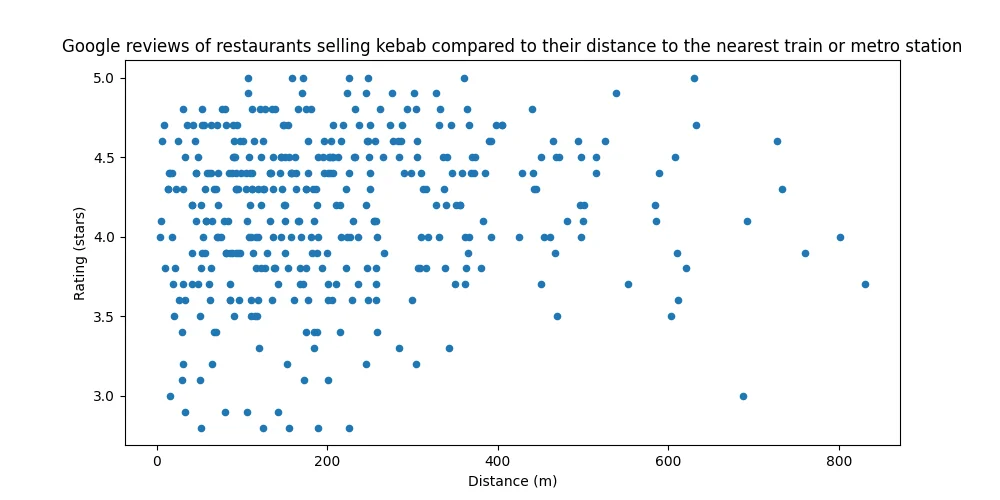 Figure 8. Removed outliers
... This increased the coefficient to a whopping 0.098.
This was a bit of a bummer (though hardly surprising) and figuring I had nothing to lose from messing around a little, I tried filtering out metro stations in case my original assumption of the metro being included in the original hypothesis was incorrect.
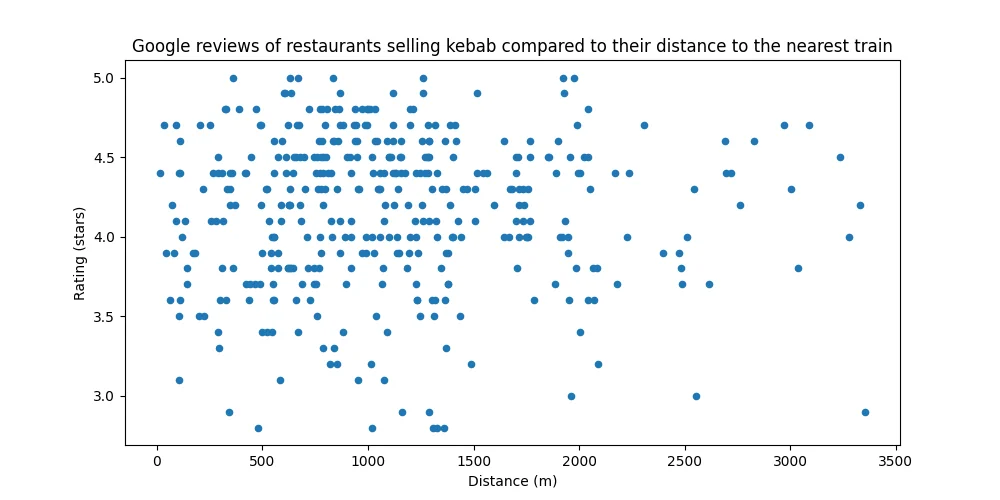 *Figure 9. Not much better, eh? Correction: "... Nearest train station entrance."
With an even worse coefficient of 0.001, I think It's time to hang up the towel.
Whilst there are some minor indications that the hypothesis could be correct (eg. Many of the absolute worst restaurants being some of the closest) the correlation is simply too weak.
- Are Google reviews an objective measurement of how tasty the kebabs are?
Absolutely the f### not. This was a rather subjective observation from the very beginning and Google reviews aren't exactly a good measure of "is the food good?" There are many aspects of the dining experience that could hypothetically impact a review score. The staff, cleanliness, the surrounding environment, etc. Not to mention online skulduggery and review manipulation.
- Can tourism have an impact?
It absolutely could. I don't want to make any definitive assumptions, but I can absolutely imagine the local regulars being harsher than the massive tourist population, or even vice-versa.
- Were the Google results accurate?
To an extent, yes. From what I could gather, every location from the query seemed to serve kebab in some form. There were a few weird outliers and nuances, such as Pizza Hut which likely only serves kebab pizza rather than the multitude of different forms in which kebab could possibly be consumed.
- Why not restaurants in general?
Because the initial hypothesis was too comically hyper-specific for me to give up on.
- What about review count?
This could very well have an effect, though I was not entirely certain how to properly implement this metric into the analysis at the time.
- Gib Data
I'm not quite comfortable in doing so, mostly due to potential breaches of Google's TOS. I don't think they would care about me harvesting some 400 POIs for this little experiment, I'm not quite willing to gamble sharing the data with others.
Besides, I gave you the code. Go burn some of your own credits.
- Are you Ok?
... I guess? Are you?
In conclusion, this was actually quite fun. I wrote this as the project went on (otherwise I would likely never have found the motivation) and I would encourage others to do other silly explorations like this, even if the results end up slightly depressing.
... However, after some additional discussion, I decided I wasn't quite done.
As stated earlier, there were a few detracting comments on the original French post. Interestingly, many of the provided examples of good kebab restaurants next to train stations just so happened to be in Paris.
The user who originally posted the French post for the sub in English provided some examples which seem to strengthen the hypothesis. It could very well be that whatever conditions affect Paris restaurants (whether it be higher rent, wages, tourism, population density...) had a larger impact than I initially suspected.
Stay tuned for part 2... Whenever I get around to doing it!